Sep 6, 2026 · 5 min · IndieRF
S-parameter Viewer: Temperature Δ for Worst-Case Analysis
Drop Plus25DegC / Minus45DegC files into S-parameter Viewer and Analysis opens Temperature — Δ vs frequency and the selected quantity vs T at the marker. A +25°C typical is not the cascade corner. Mini-Circuits EQY-2-63+ files are the worked example.
S-parameter Viewer reads temperature from the filename (Plus25DegC, Minus45DegC) or from a Temp: 25C comment. Load two or more tagged .s2p files and Analysis opens the Temperature tab: Δ versus frequency against a +25°C reference, and the selected quantity versus T at the marker, with a linear fit.
The screenshots and the live view use three Mini-Circuits EQY-2-63+ lab files, Unit 2, lot E14070 / 1804, fixture TB-1041-2-63+. Same job for any vendor set you name with a temperature.
Why temperature belongs in worst-case analysis
A datasheet electrical table is almost always at +25°C. The operating box is not. EQY-2-63+ quotes insertion loss and VSWR at +25°C and lists operating case temperature −40°C to +85°C. The number you paste into a cascade budget is a temperature-dependent quantity. Using the room-temp typical as if it were the hot and cold corner is how a 1 dB margin disappears on the first thermal cycle.
Worst-case analysis on an RF chain is not “add 2 dB and call it temperature.” It is: at the frequency that limits you, what does this part do at the cold and hot ends of the spec, and does that walk stack with the amplifier in front of it? Gain, insertion loss, match, and — for an equalizer — slope all move. An equalizer that is 0.12 dB worse at 6 GHz when hot is a small number until the driver also droops and you bought both to a typical line.
The lab files below include a −45°C point, 5°C past the −40°C operating min. Treat that as a chamber corner, not a license to spec the part there.
Name the files, then open Temperature
From S21 this part classifies as an equalizer, so Auto X is the file span, not the datasheet. These sweeps run 10 MHz–10 GHz. The EQY-2-63+ electrical table stops at 6 GHz. Auto marker is the midpoint, 5.005 GHz. Set Manual start/stop to 0.01–6 GHz before you score the datasheet. Leave Auto on when you want everything the VNA recorded.
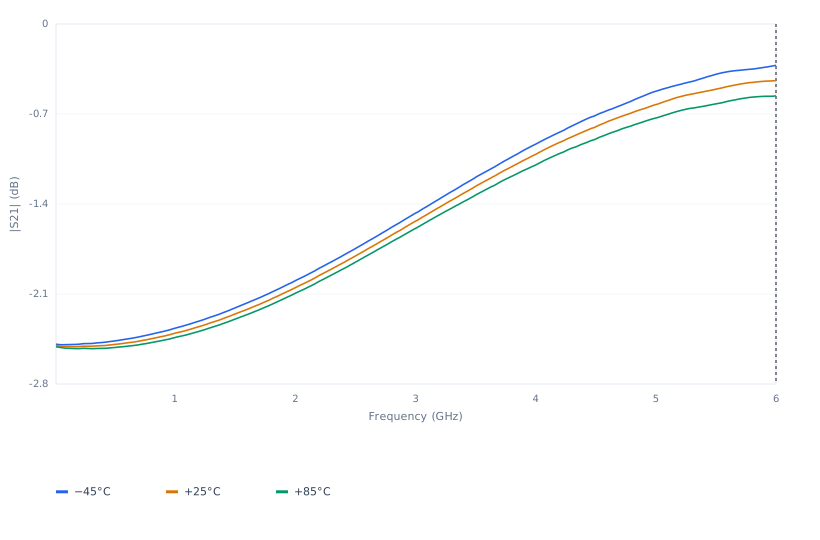
The plots in this section are static copies. The live Analysis view is below; change the marker there.
At +25°C, Unit 2 matches the typical table to rounding: 2.4997 dB IL at 10 MHz (typ. 2.50 dB), 2.405 dB at 1 GHz (typ. 2.40 dB), 0.44053 dB at 6 GHz (typ. 0.44 dB). Cold is less loss. Hot is more. The walk grows with frequency.
| T | S21 @ 1 GHz | S21 @ 6 GHz |
|---|---|---|
| −45°C | ||
| +25°C | ||
| +85°C |
Δ vs the +25°C file
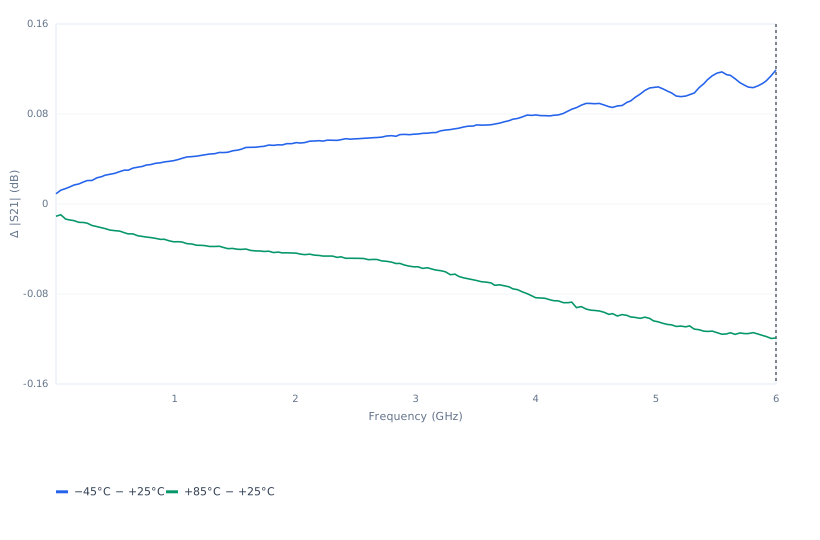
Temperature Δ is on a common grid. Reference is +25°C when that file is present.
| T vs +25°C | Δ @ 1 GHz | Δ @ 6 GHz |
|---|---|---|
| −45°C | ||
| +85°C |
At 6 GHz this unit is ±0.12 dB from the room-temp file at the lab corners. At 1 GHz the same corners are ±0.04 dB. The typical 2.40 dB line at 1 GHz is still the right first-pass number. The 6 GHz line is where temperature shows up in a budget.
The vs-T chart at the marker is a three-point linear fit. Analysis prints it as slope / R² / n:
| Marker | slope | n | |
|---|---|---|---|
| 1 GHz | 3 | ||
| 6 GHz | 3 |
Three points that happen to lie on a line are not a thermal model. They are a measured slope you can put next to the datasheet typical and decide whether the corner matters.
What to change
Keep the temperature in the filename. Drop your own set on S-parameter Viewer.
- Confirm kind. An equalizer Auto-X uses the file span, so a 10 GHz sweep is not a 6 GHz spec.
- Switch Analysis to Temperature. Set Manual start/stop to the datasheet window if that is what you are scoring.
- Move the marker to the frequency that limits the cascade, not the midpoint of the file.
- Read Δ vs +25°C, then the slope at that marker. Switch quantity to if match is the spec you bought.
When +25°C is enough
A single +25°C .s2p is the right first-pass number for a cascade sketch, and it is the plane the datasheet is written on. Overlay temperature when insertion loss is your margin, the part is flattening something else that also walks, or you are about to copy “typical” into a worst-case stack that is supposed to be hot and cold.
This unit’s 0.12 dB walk at 6 GHz is not a license to ignore the next date code, and it is not small if every stage in the chain does the same.
What this is not
S-parameter Viewer is a browser plotter, not a thermal chamber and not a cascade solver. Δ is file minus file on the selected quantity. The vs-T slope is a least-squares fit through the parsed temperatures; three points do not make a physics model. Auto edges are the sampled grid, not a fitted equalizer. The −45°C file is a lab corner outside the −40°C operating min.
The scalar cascade in RF Cascade Analyzer still treats a block as gain/NF at one frequency. It does not ingest these .s2p files as a two-port, and it does not apply this Δ unless you type it in.
Discussion
No comments yet. Start the thread with a measurement, a correction, or a worked example.