Smith chart
Printable Smith chart PDF
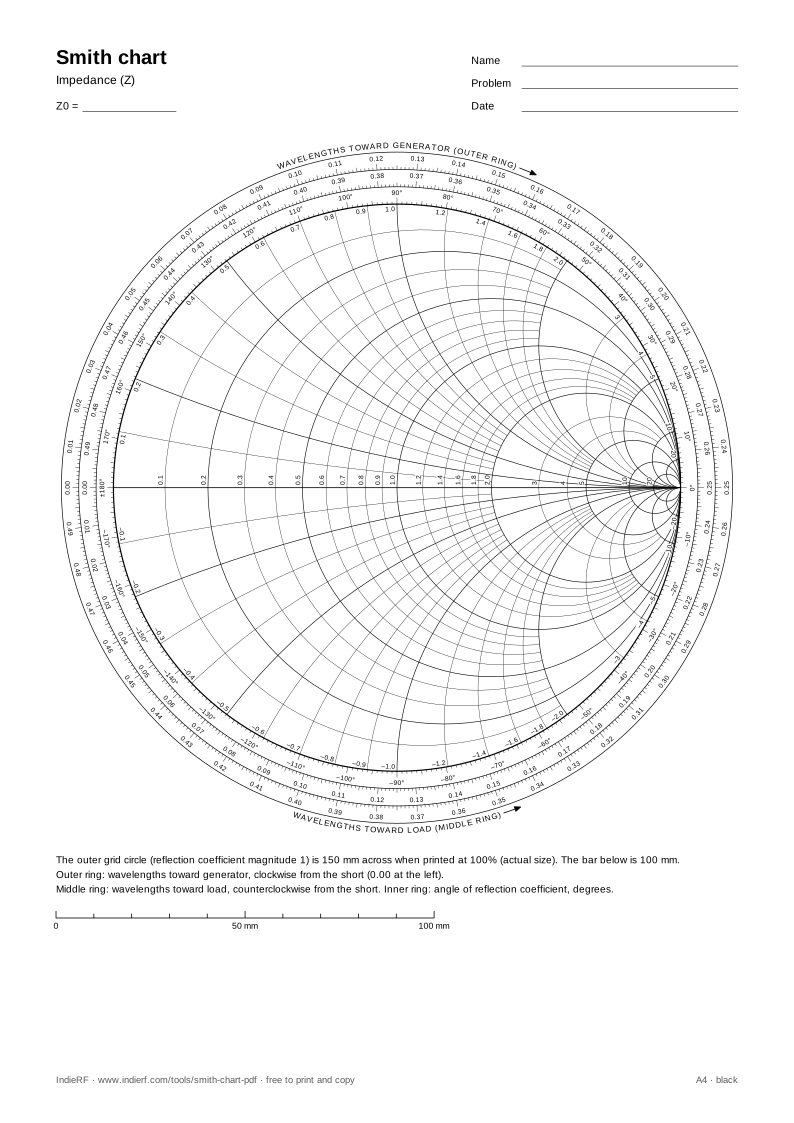
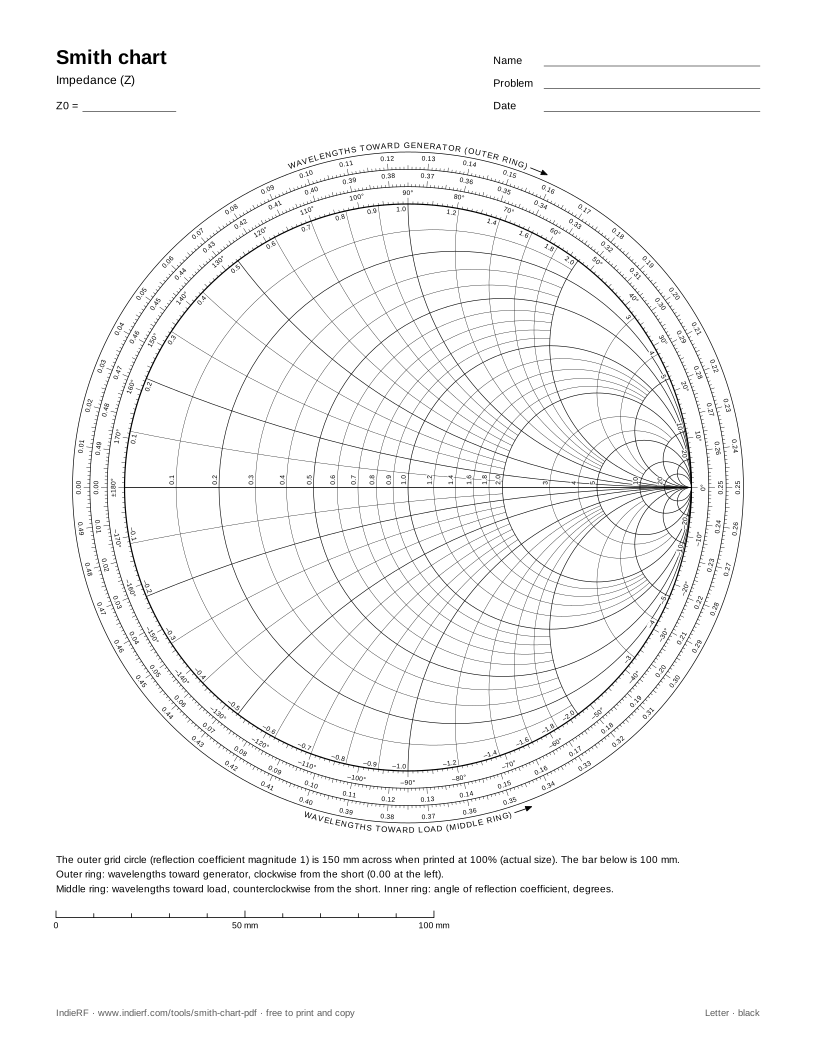
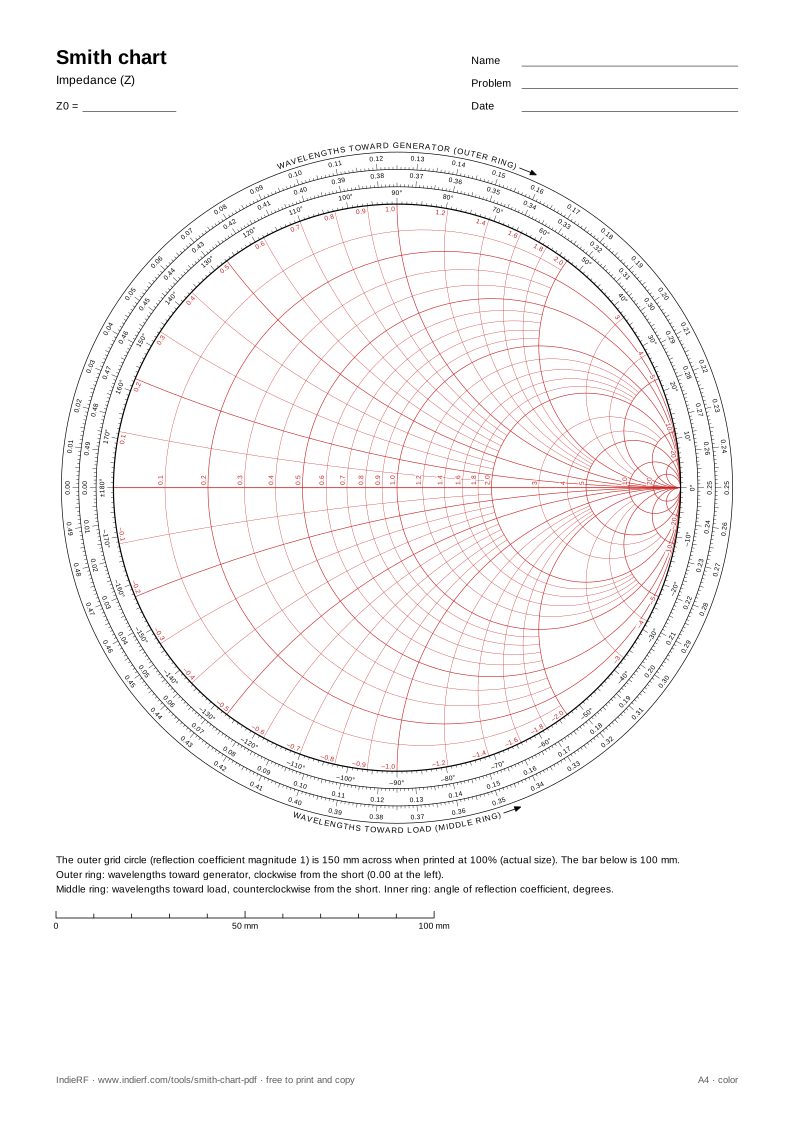
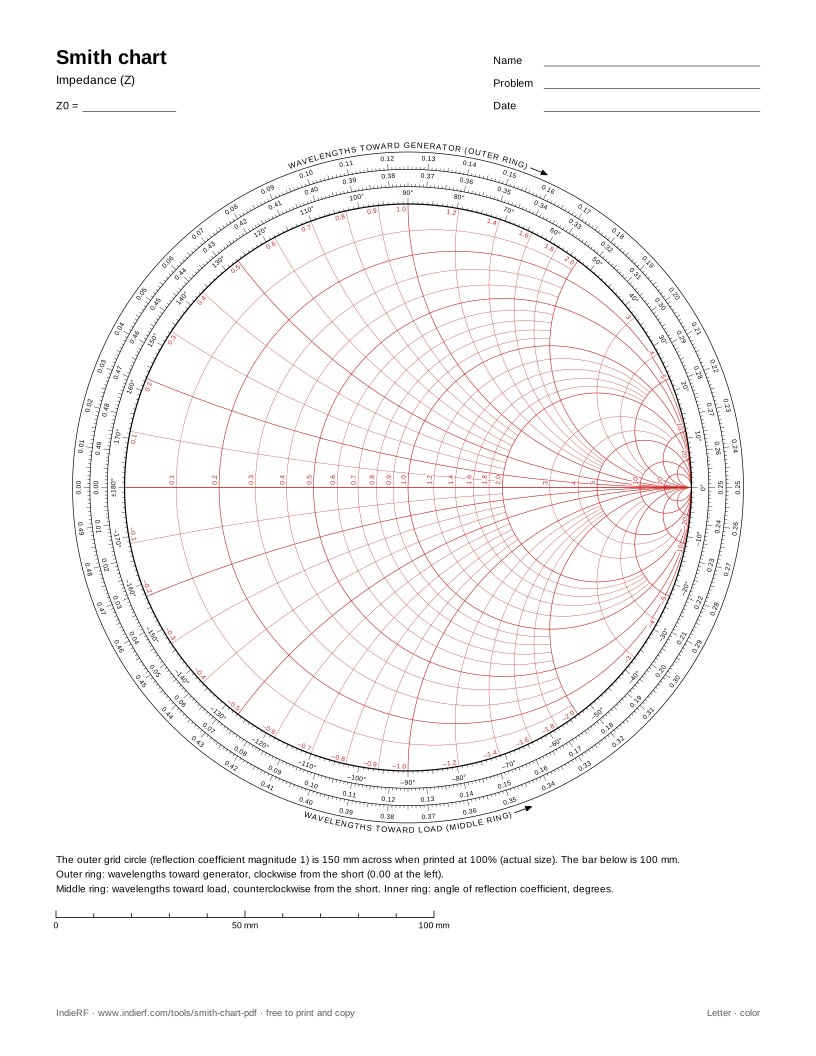
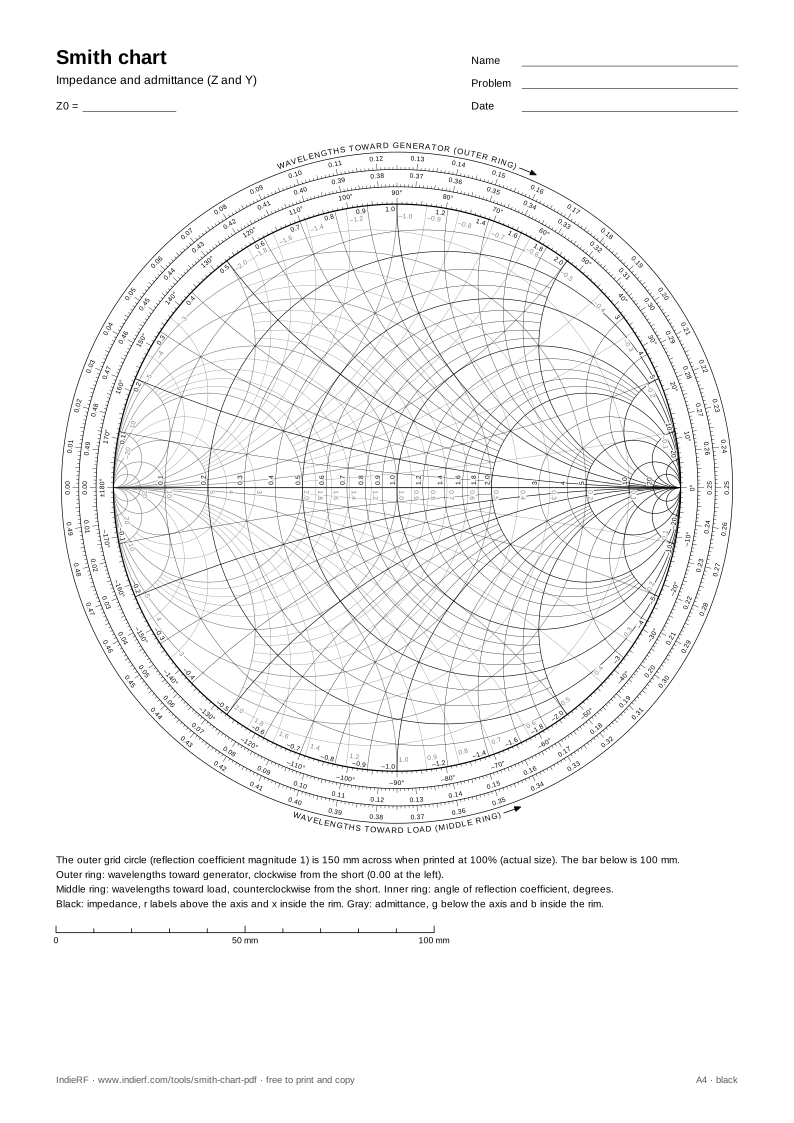
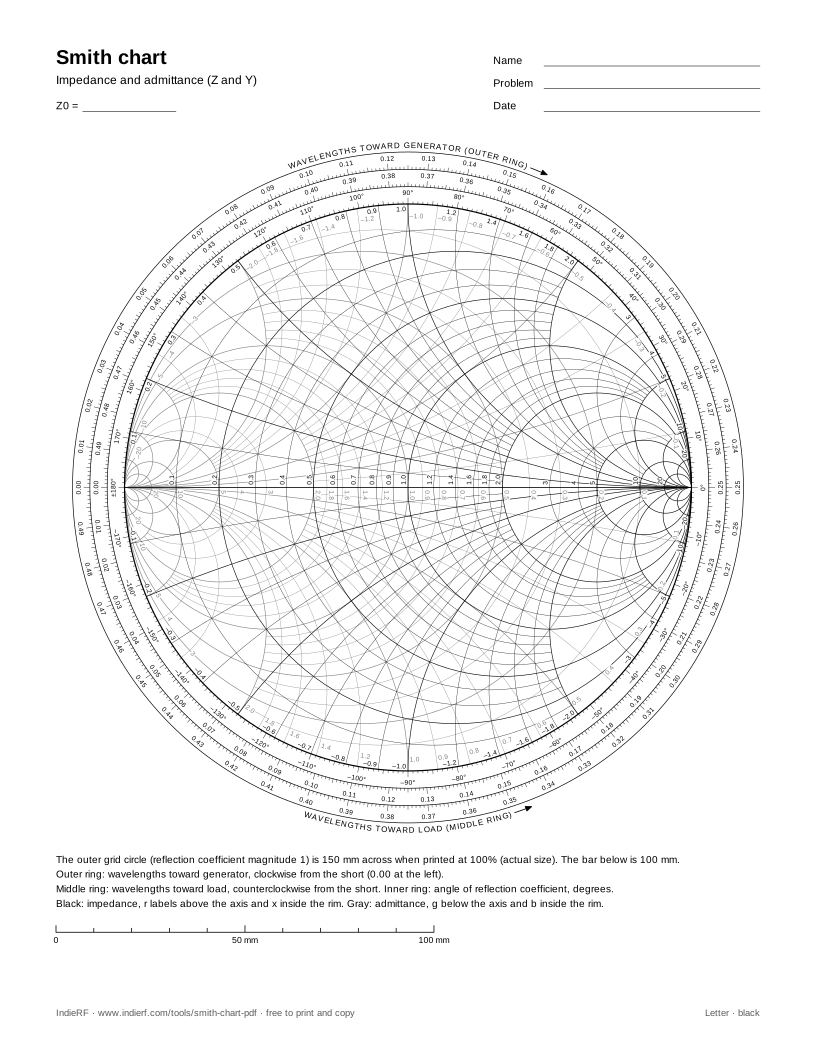
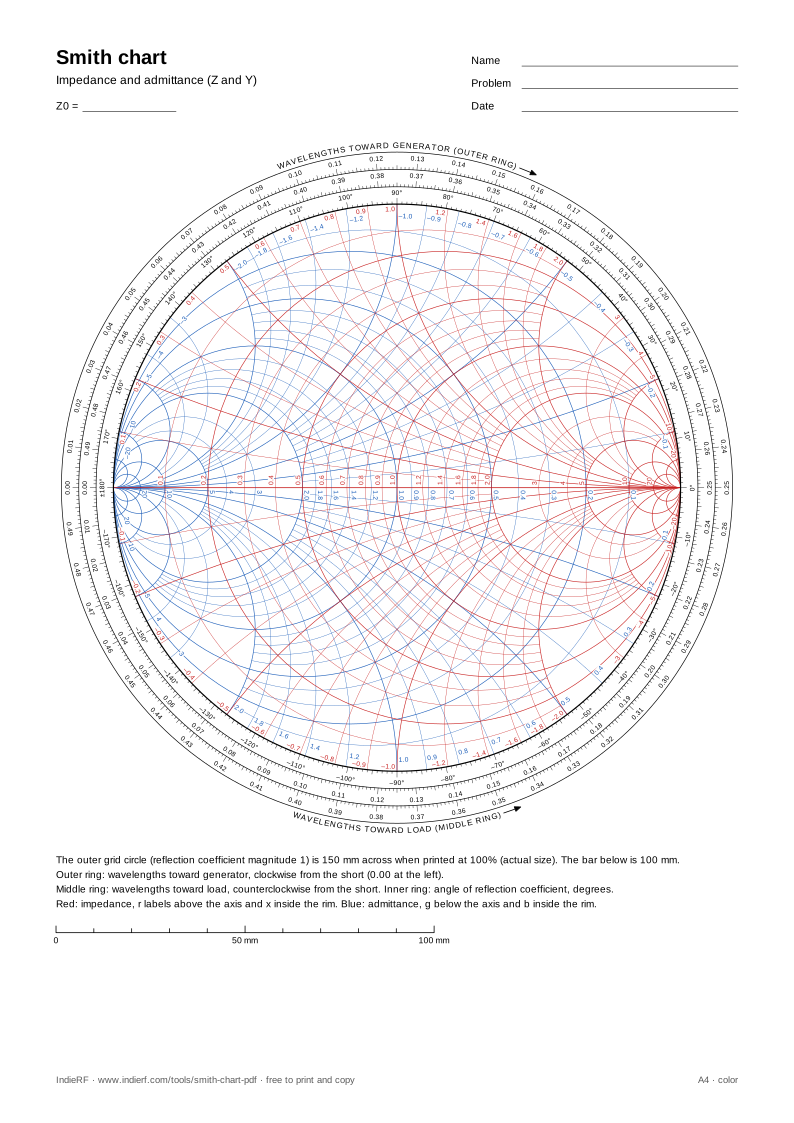
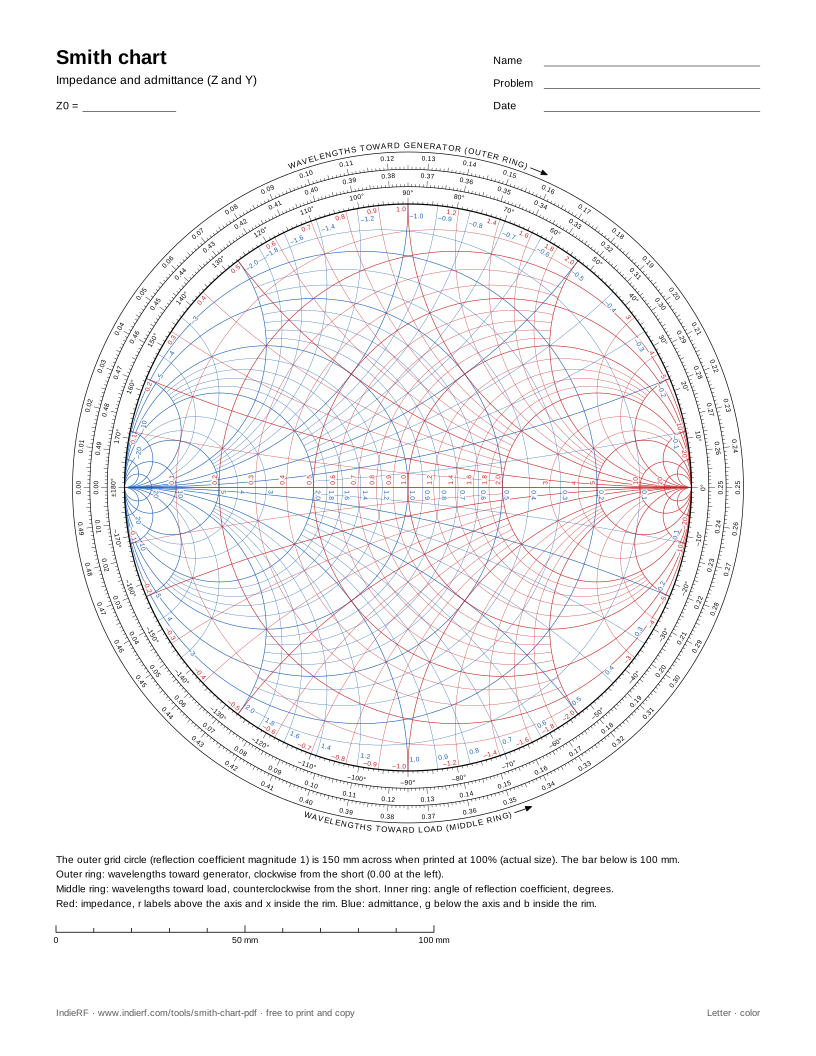
Blank Smith charts to print, free with no sign-in. The |Γ| = 1 circle is 150 mm across at 100% scale on both A4 and Letter, with wavelengths toward generator, wavelengths toward load and the reflection-coefficient angle around the rim.
Impedance (Z), black
Impedance (Z), color
Impedance and admittance (ZY), black
Impedance and admittance (ZY), color
Printing at the right size
Print at 100% or “Actual size”. “Fit to page” shrinks an A4 sheet onto Letter by 6% or more. The rim readings stay right because they are angles, but the chart is no longer 150 mm. Each page carries a 100 mm bar to check with a ruler, and the PDF marks print scaling as none.
Reading the rim scales
The outer ring counts wavelengths toward the generator, clockwise from 0 at the short on the left. A distance d sits at a reflection-coefficient angle of 180° − 720°·d, so 0.125 λ is at the top, 0.25 λ is at the open on the right and 0.5 λ is back at the short. The middle ring counts wavelengths toward the load from the same zero, counterclockwise. The inner ring is the angle of Γ in degrees: 0° at the open, ±180° at the short.
A single-stub problem reads straight off these: move the load toward the generator until it meets the g = 1 circle, and the outer ring gives the stub distance as the difference of two readings. Reading the toward-load ring by mistake gives 0.5 λ minus the distance to the other solution: a plausible number, and wrong.
The grid
r and x run 0.1 to 1 in steps of 0.1, 1.2 to 2 in steps of 0.2, then 3, 4, 5, 10 and 20. Minor lines stop on a major line at 2, 5 or 10 so the crowd near the open stays readable. r labels sit above the real axis and x labels inside the rim. On the ZY chart the admittance grid is the impedance grid turned 180° about the center, in blue on the color sheet and gray on the black one, with g labels below the axis and b labels in a second row inside the rim. The curves are the same circle formulas as the interactive Smith chart, written as vector arcs, so they stay sharp at any zoom.